Business Need: Each of our clients has different operational needs, some for management, others for communication, or both.
Case Study 1 - A client in the restaurant industry was looking for a management tool to calculate their insurance premiums based on the surface area of each of their entities' sites.
Case Study 2 -An industrial client wanted a communication tool in which they could mass-integrate their insurance data and present it in the form of reports communicated to their general management.
Case Study 3 - Two Risk Manager clients were looking for a tool that allows for both : managing the assessment of their risks within each of their Groups and communicating the results.
Theoretical Approach: Dr. David HILLSON (the Risk Doctor) created a video addressing this topic, “How should we communicate risk information to stakeholders?”
To explain the importance of reporting, he uses the analogy of realizing its value the day your phone screen breaks. You might have a fabulous analysis, but if you can't see anything... Reporting allows us to communicate the results of an analysis. It shows what has been found.
In this video, he helps us list 3 principles for effective risk reporting:
To learn more: here is the link to the video and the Risk Doctor Video channel
Principle 1 - The objective of Risk Management and reporting is twofold, it is to capture stakeholders' attention and encourage them to act. 1. Attention: Reporting explains something the reader needs to know but doesn't yet. 2. Action: Reporting recommends what this person should do but isn't doing yet.
Principle 2 – Different people will want different information: there is a wide variety of stakeholders to whom reporting can be presented (client, regulator, employee, competitor, etc.). Each stakeholder has different needs, and therefore requires information on different risks. To adapt the reporting to the needs of each stakeholder, I must ask myself: what information, on what risks, does each stakeholder need? For example, a decision-maker will be interested in a summary of the top 5 risks and top 5 opportunities, which I would present as a PowerPoint with a dashboard. This need will not be the same as that of a regulator, who would prefer an extraction in the form of a table.
Principle 3 – Present information using the right vocabulary and in the right way. It is important to consider adapting the vocabulary to the person receiving the report and presenting it with the appropriate communication tool (email with attachment, interactive dashboard, summary with PowerPoint support, etc.). For example, a senior manager understands profit, reputation, and the future = security. He suggests delivering risk reporting using vocabulary tailored to the recipient. A technical specialist or a project team will not expect information in the same way in terms of vocabulary and presentation.
Conclusion : We must consider presenting our risk analysis in a way that provides a summary of the right information, adapted to the needs of our interlocutor, written in their appropriate vocabulary, while using it to ensure that the right actions are taken.
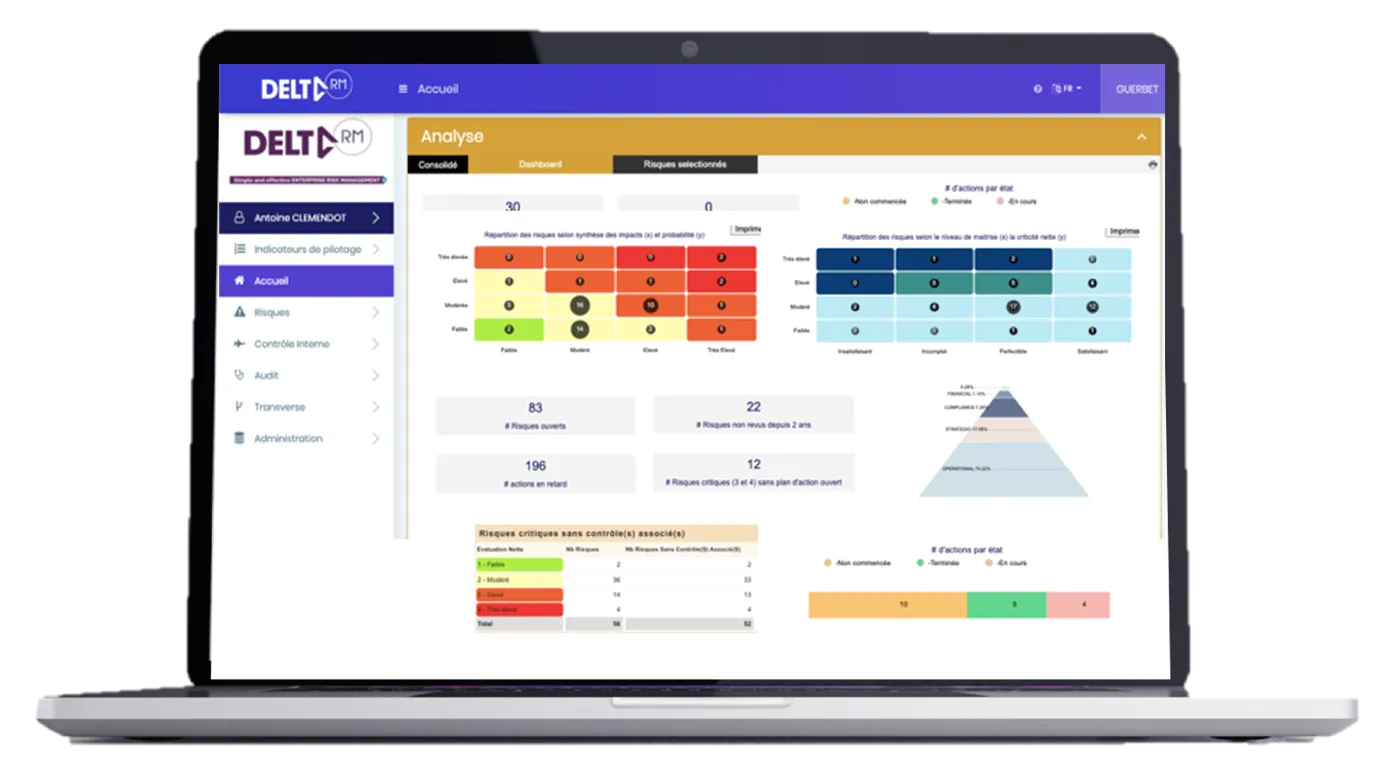
Operational Approach: how does this work at DELTA RM?
At DELTA RM, we have integrated business intelligence into our software that allows for the modeling of all information integrated into the tool. A dedicated team is responsible for customizing reports to each client's needs. We have standard reports that suit most requirements, which we can adapt to each client's specificities. More importantly, we can create custom reports for new needs.
Case Study 1 - For the client who wanted a calculation tool, once their network has completed the value collection questionnaire, the reporting calculates the premium. The client then just needs to download the report as an Excel spreadsheet to send the values to insurers.
Case Study 2 - For the client who wanted a communication tool, they just need to import their Excel files, and it generates a PowerPoint presentation that they only need to finalize before presenting it to the board.
Case Study 3 - For those who wanted both : they have an interactive dashboard from which they can export each visual to enhance their PowerPoint presentations and illustrate their emails.
Method: At the start of a project, we ask each of our clients to provide us with their reports to create tailored proposals. Either our standard reports are suitable, or we develop new ones.
If you would like to know more, please contact us.